
5 Hidden Packaging Costs to Audit Before You Lock Your 2027 Budget

A hidden packaging cost is any expense created by a packaging decision that never appears on the material invoice. In food and beverage, the common sources are over-specified features, surplus SKU variants, trim and filling-line waste, the freight and inventory effects of supplier choices, and excess air or weight in distribution. They surface only when specification, plant and logistics data are read together.
Most packaging budgets start with a supplier quote. Price per thousand units, multiplied by forecast volume, plus a line for freight. The number is real, and it is also the smallest visible part of what packaging costs a food or beverage brand to own.
The rest sits where the material invoice never reaches. One closure exists in four variants because nobody checked three launches ago. Film loses part of every roll to trim and setup scrap before a single pack is filled. Cases leave the line carrying more headspace than product. These are hidden packaging costs, and they compound as a portfolio grows.
This guide covers five of them in the order we would audit them, plus a sixth driver that now touches all five: regulatory fees charged by weight and material. Each section ends with the one question your team should be able to answer before the 2027 packaging budget is locked.
Why does the material invoice understate what packaging costs?
Packaging cost is decided in six places: material selection, specifications, SKU complexity, manufacturing efficiency, distribution and regulatory compliance. The supplier invoice captures part of the first. The other five show up in plant yield reports, logistics invoices, warehouse inventory days and, since extended producer responsibility (EPR) schemes began charging by weight, in producer fee statements.
Different teams own those records. R&D owns the specification, procurement owns the quote, operations owns yield, supply chain owns freight. Nobody holds the sum, which is why the same leaks survive budget cycle after budget cycle.
| Hidden cost | Where it hides | Data to pull | Typical owner |
|---|---|---|---|
| Over-engineered specifications | Thickness, barrier layers, unused features, format choice | Specification sheets against product and channel needs; competitor teardowns | R&D, packaging development |
| SKU complexity | Pack sizes, closures, structures, components | Component count per SKU, volume per component, changeover log | Marketing, supply planning |
| Material and production losses | Trim, setup scrap, rejects, filling-line losses | Material yield by supplier and by line | Operations, quality |
| Sourcing economics | Fragmented suppliers, MOQs, freight, inventory | Landed cost per pack, inventory days, on-time delivery | Procurement |
| Distribution inefficiency | Headspace, weight per gram of product, case and pallet fill | Pack weight, case cube, pallet utilisation | Supply chain, logistics |
The five audit areas, with the data each one needs and the team that usually holds it.
Budget season is the cheapest moment to look. Once volumes, specifications and supplier terms are fixed for the year, every change triggers a changeover, a re-qualification or a renegotiation. Find a leak in October and it is a line in the plan. Find it in July and it is a project.
Hidden cost 1: are over-engineered specifications adding cost without adding value?
Specifications drift. A barrier layer is added for a launch that needed twelve months of shelf life, and the product now sells through in eight. Film gauge goes up after a single co-packer complaint and never comes back down. A Euro-slot hanging hole stays on a pack that no longer goes to pegboard retail. Each one adds material, a tooling step or a conversion charge, and none appears as a line item because all of them sit inside the unit price.
Three checks catch most of it:
- Thickness and gauge, measured against the protection the pack actually needs in drop, compression and puncture testing rather than the legacy specification
- Barrier properties, set against measured shelf life and real time in distribution
- Features such as Euro-slot holes, tear notches and extra seals, checked for whether any retailer or consumer still uses them
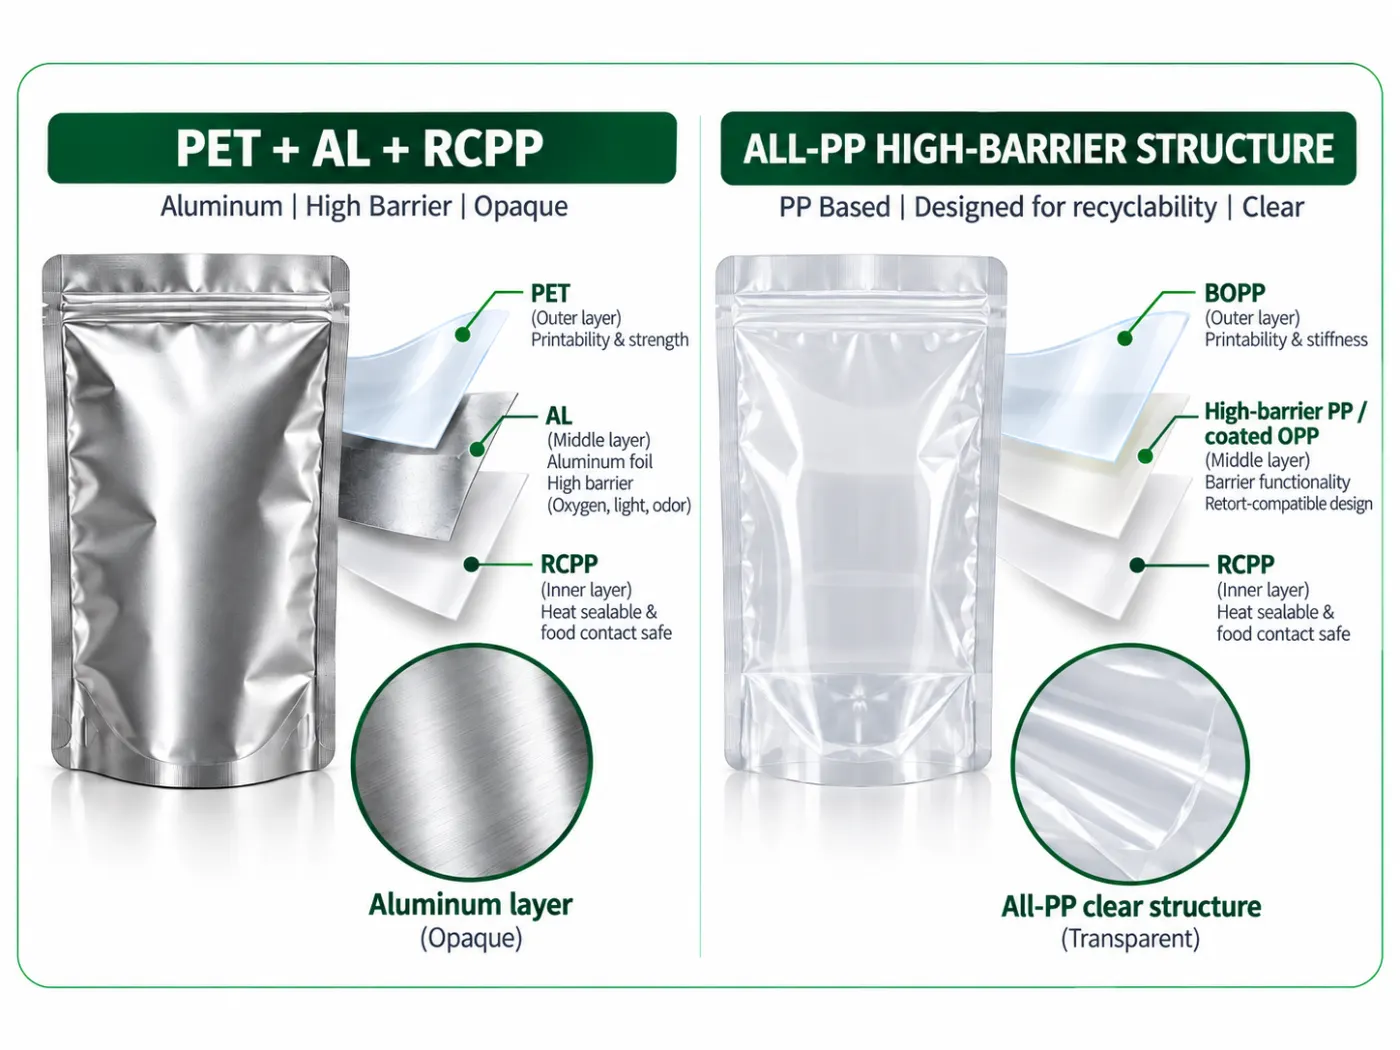
Two high-barrier pouch structures: PET + aluminium + RCPP (opaque) and all-PP (clear, designed for recyclability). Barrier, recyclability and cost move together, so the structure decision belongs in the cost review.
Format changes deserve the same scrutiny. Moving from rigid to flexible can cut material weight sharply, but it pays only when total cost, line fit, protection and shelf life all hold. A pouch that forces a slower filling speed has moved cost, not removed it. Fees matter here too. EPR charges are set per pound by material category, and flexible laminates sit at the expensive end: in Oregon's 2026 rates, flexible polypropylene film and plastic laminates run at 102 cents per pound against 8 cents for plain paperboard (EcoEnclose, 2026). A weight saving has to be large enough to survive that rate.
Engineering can also remove cost without adding material. Packfora's finite element analysis of a 13kg banana box found that vent shape and placement, not vent count, was weakening the carton. Triangular vents in new positions delivered 10% more compression strength and 17% more top vent area with zero additional material (read the banana box study).
Start the review by benchmarking competitors and adjacent categories. If a rival ships the same product in a lighter structure, your specification is a hypothesis rather than a requirement. Packfora's packaging cost benchmarking guide covers what to measure and which data sources hold up, and specification management is where the corrected specification needs to live so it does not drift again.
AUDIT QUESTION
When did you last benchmark packaging materials, features and formats against actual product and channel needs?
Hidden cost 2: is every packaging variation creating value?
Different pack sizes, closures, structures and components each add tooling, inventory, changeovers and procurement work. Variety itself is fine. The problem is that components multiply faster than anyone budgets for.
Bain's analysis of a food company it called FoodCo shows the pattern. Between 2010 and 2013 its recipes grew 12% and its containers grew 36%, with caps up 28% and labels up 51%, while volume fell 2% (Bain & Company, 2014). Packaging components grew between two and four times faster than the recipes they carried. In the same study, a European beverage company cut one brand from 63 bottle types to 20 as part of a wider simplification programme that produced a 45% reduction in complexity costs and 16% gains in revenue per SKU.
McKinsey's work on a global food manufacturer points the same way. SKU count rose 66% in three years, sales per SKU fell 40% and margins dropped by up to 10% in some categories. After simplification, SKU count fell 25% and gross margin improved by 2 to 4% (McKinsey, 2016). Both sources count product SKUs rather than packaging alone, but every SKU carries its own components, so the packaging cost travels with it. Both are also several years old. Treat them as proof of mechanism, not a forecast for your portfolio.
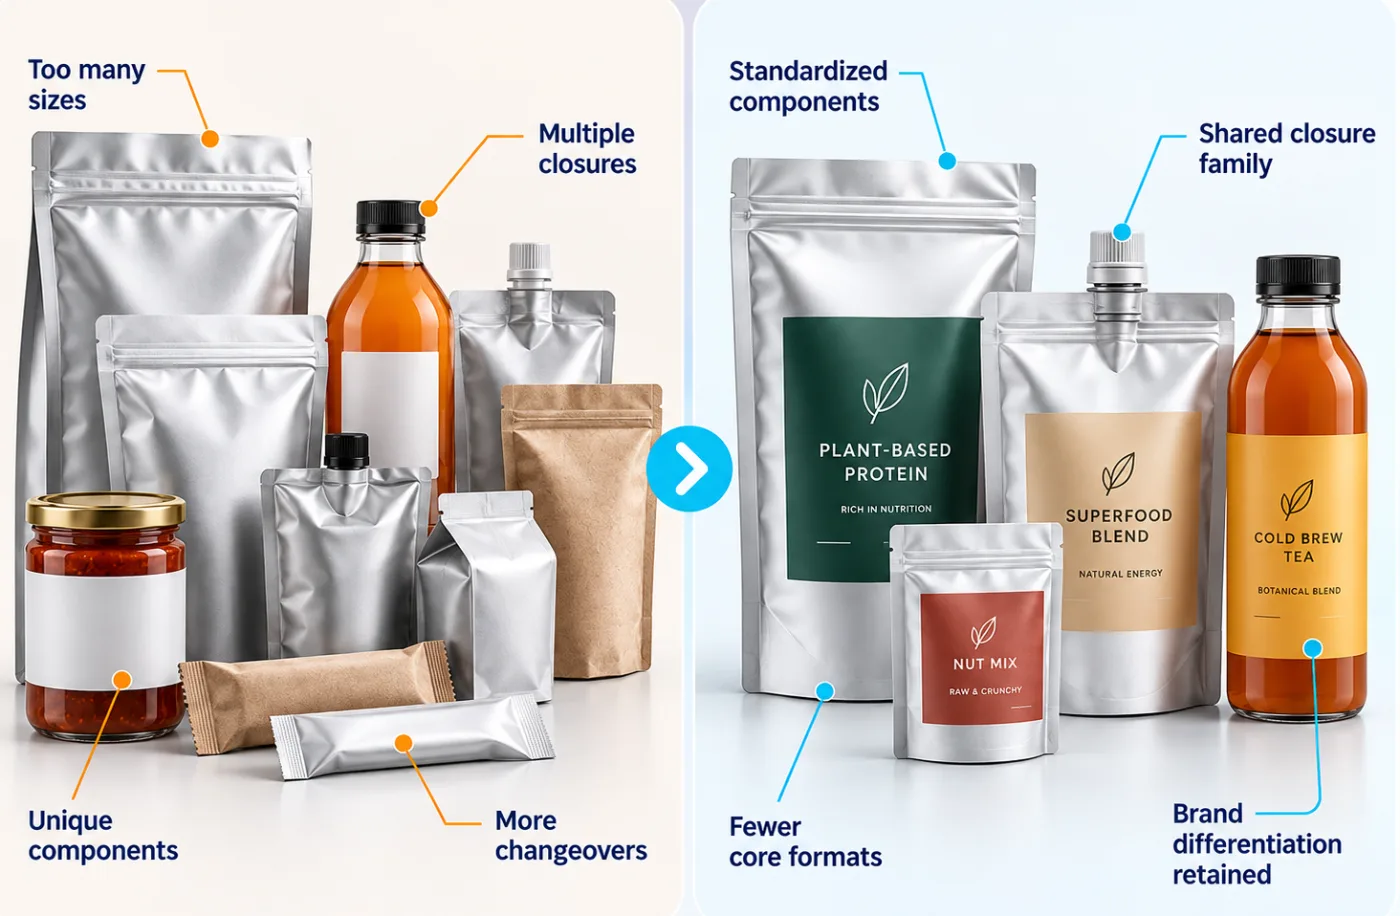
Standardised components, a shared closure family and fewer core formats cut changeovers, while labels and brand identity keep the products distinct.
The fix is to standardise components and leave identity alone. A shared closure family, common neck finishes and fewer core pouch formats reduce tooling and changeovers while labels, colour and print carry the differentiation. To find candidates, list every component, count the SKUs that use it and attach annual volume. The long tail of low-volume, single-SKU components is usually where the savings are. Packfora's QSR packaging standardisation framework shows how locking a core specification first makes regional variation cheaper to manage, and the home care cost and complexity case study covers a structural redesign for a leading home cleaning brand.
WHY COMPLEXITY COST STAYS HIDDEN
It is split across budgets. Tooling sits in capex, changeovers in plant efficiency, inventory in working capital and procurement effort in no budget at all. Each owner sees a small number. Nobody sees the total.
AUDIT QUESTION
Which packaging components could be standardised without compromising brand differentiation?
Hidden cost 3: how much value is lost before a saleable pack exists?
Waste starts at the packaging supplier. Trim loss at conversion, setup scrap at the start of every job and rejects after inspection are all priced into what you buy. The filling line then adds its own: start-up losses, changeovers, jams and rejected packs. Each loss raises the cost of every saleable pack.
Supplier-side losses sit inside the quote. Filling-line losses sit inside your cost of goods. Neither is visible unless someone tracks material in against saleable packs out.
The arithmetic is short. Material yield is the material that ends up in saleable packs divided by the material received. Effective cost per saleable pack is the quoted cost divided by yield. As an illustration, a film quoted at 1.00 per unit of usable material with 94% yield costs about 1.06 per saleable unit, and a three-point yield gain on that film is worth about 0.03 per unit before anyone touches the price.

Filling-line start-ups, changeovers and rejects add to whatever the packaging supplier already lost in trim and setup scrap.
The productive version of this is a joint effort. Brand and supplier improve material yield and productivity together, with the agreed conversion-cost savings reflected in pricing. That works only with a shared baseline: an agreed yield, a measurement method and a rule for how savings flow into the price. A should-cost model supplies that baseline by splitting a quote into material, conversion, scrap and margin, which is also how you test whether a supplier's quoted yield is realistic. Packfora's piece on should-cost versus quoted price walks through the comparison.
AUDIT QUESTION
Are you tracking material yield and waste across both packaging suppliers and filling operations?
Hidden cost 4: is your lowest quote really your lowest cost?
Supplier fragmentation, minimum order quantities, freight, inventory and sourcing constraints can cancel out an apparent unit-price saving. Total cost of ownership is the corrective: unit price, plus freight, plus the cost of holding inventory, plus the cost of unreliability, meaning line stoppages, expedited freight and rework.
| Cost element (100,000 units a year) | Supplier A, lowest quote | Supplier B |
|---|---|---|
| Unit price | 18,000 | 24,000 |
| Freight | 6,000 | 2,500 |
| Inventory holding (MOQ-driven stock, storage, obsolescence) | 5,500 | 1,800 |
| Reliability (expedites, line stoppages) | 4,000 | 500 |
| Total cost | 33,500 | 28,800 |
| Cost per unit | 0.335 | 0.288 |
Hypothetical figures to show the mechanics, not client data. Supplier A quotes 25% less per unit and costs about 16% more to own.
MOQs turn into stock that ties up cash and can become obsolete at the next artwork or regulatory change. Fragmentation across many suppliers multiplies freight lanes, purchase orders and qualification work. Reliability is the quietest line: it appears only as an expedite fee or an idle line, usually booked to operations.

Comparing supplier options on unit price, MOQ, freight, inventory and reliability together. Illustrative image.
Consolidation is not automatically the answer. Moving to fewer suppliers cuts freight and administration but raises dependence, and the right call differs by component. What matters is that supplier decisions are scored on total cost, quality and service together. Packfora's packaging procurement strategy framework and its guidance on packaging supplier consolidation set out how to build that scorecard, and the packaging procurement practice runs it against live supplier data.
AUDIT QUESTION
Are supplier decisions evaluated on total cost of ownership, quality, and services?
Hidden cost 5: is your packaging built for the journey or just the shelf?
Excess headspace and high packaging weight per gram of product raise material and shipping costs. Right-sized packs improve case and pallet utilisation, which lowers the cartons, trucks and handling touches needed per thousand units sold. Parcel carriers bill on the greater of actual or dimensional weight, so air inside an e-commerce shipper is charged as if it were product.
Regulation is moving the same way. The EU Packaging and Packaging Waste Regulation (PPWR) caps the empty space ratio at 50% for grouped, transport and e-commerce packaging, and requires packaging weight and volume to be reduced to the minimum necessary for function. Both apply from 1 January 2030 (Latham & Watkins summary; the 50% figure is also stated in recital 84 of Regulation (EU) 2025/40). A 2027 budget sits three years ahead of that date, but pack designs approved next year will often still be in market in 2030. Right-sizing now avoids a second redesign and requalification cycle later.
The review has to be system-level, because a smaller pack that harms filling performance, product integrity or shelf life only moves cost around. Track five figures per pack: weight per gram of product, headspace as a share of internal volume, units per case, cases per pallet layer and pallet cube utilisation. Packfora's packaging material optimisation guide sets out a decision matrix for when to right-size, respecify or redesign.

Case and pallet efficiency is decided long before a truck is loaded, at the point the pack dimensions are set.
AUDIT QUESTION
Have you assessed pack weight, headspace and case/pallet efficiency across your distribution channels?
The sixth driver: how do regulatory fees change the maths?
Regulatory compliance is the sixth cost driver, and it now touches every area above. EPR schemes charge producers by the pound, with a rate set per material category. That attaches a fee to the choices covered so far: which material a specification calls for, how many distinct components a portfolio reports, how much each pack weighs.
| Reporting category (cents per pound) | Colorado 2026 | Oregon 2026 |
|---|---|---|
| Paperboard | 8 | 8 |
| Polycoated paperboard | 20 | 48 |
| HDPE/LDPE flexible and film | 48 | 43 |
| PP flexible and film | 64 | 102 |
| Plastic laminates and other flexible | 74 | 102 |
Base rates as summarised by EcoEnclose (2026). Rates are reset by programme year and adjusted by eco-modulation bonuses and penalties, so confirm current figures for each market.
Two things follow. The fee line belongs in the same business case as the material saving, because a lighter structure in a higher-fee category can lose on net. And the numbers will move: programme rates reset each year, and modulation rewards recycled content and recyclability. Packfora's explainers on EPR packaging fees and eco-modulation and on what is operational under PPWR after 12 August 2026 track both, and the sustainability practice can fold fee exposure into a pack-level cost model.
How do you run a packaging cost audit before the 2027 budget locks?
Sequence matters more than speed. Negotiating before you simplify means negotiating on volumes and specifications you are about to change, a point Packfora's packaging value engineering framework makes about order of operations. Run the audit in this sequence:
- Build the portfolio sheet: every SKU, every component, with supplier, annual volume and weight, in one file.
- Review specifications and variants first. Strike unused features, test lighter gauges and mark components that can be shared.
- Measure yield at both ends. Ask suppliers for trim, setup scrap and reject rates, and pull filling-line losses from plant data.
- Re-cost sourcing on a landed basis: price, MOQ-driven stock, freight and delivery reliability.
- Run a cube-and-weight review of pack, case and pallet for each distribution channel.
- Add fee exposure per pack, using current EPR rates for each market you sell into.
- Rank findings by value and difficulty, then take the top three into the 2027 plan with a named owner each.
| Metric worth tracking permanently | What it exposes | Where the data lives |
|---|---|---|
| Component-to-SKU ratio | Complexity creep | Portfolio sheet |
| Material yield (%) | Supplier and filling-line waste | Supplier reports, plant data |
| Landed cost per saleable pack | Sourcing economics | Procurement and logistics records |
| Pack weight per gram of product | Over-specification and headspace | Specifications, lab testing |
| Fee exposure per pack | Regulatory cost | EPR and PPWR reporting |


